Crystalline silica shows up on every exposure report, yet it still catches experienced mining operations off guard. The reason is geological: quartz is the second most abundant mineral in the earth's continental crust, and it rides along in the host rock of nearly every ore body on the planet. When you drill, blast, crush, or convey that rock, you generate respirable dust that carries quartz fragments small enough to reach the deepest regions of the lung.
A single shift can produce wildly different exposure readings depending on the task, the geology of the face being worked, and the ventilation conditions at that moment. That variability is the core problem this article addresses. Understanding where silica hides across a mining operation, and why one compliance sample can never fully characterize the risk, changes how you design controls, allocate monitoring resources, and protect your crews.
What Is Crystalline Silica and Why Mining Generates So Much of It
Silicon dioxide (SiO₂) exists in several crystalline forms. Quartz is by far the most common, followed by cristobalite and tridymite. The International Agency for Research on Cancer classifies inhaled crystalline silica in the form of quartz or cristobalite as a Group 1 carcinogen, meaning sufficient evidence links it to cancer in humans. Prolonged exposure causes silicosis, contributes to chronic obstructive pulmonary disease, and increases the risk of kidney disease.
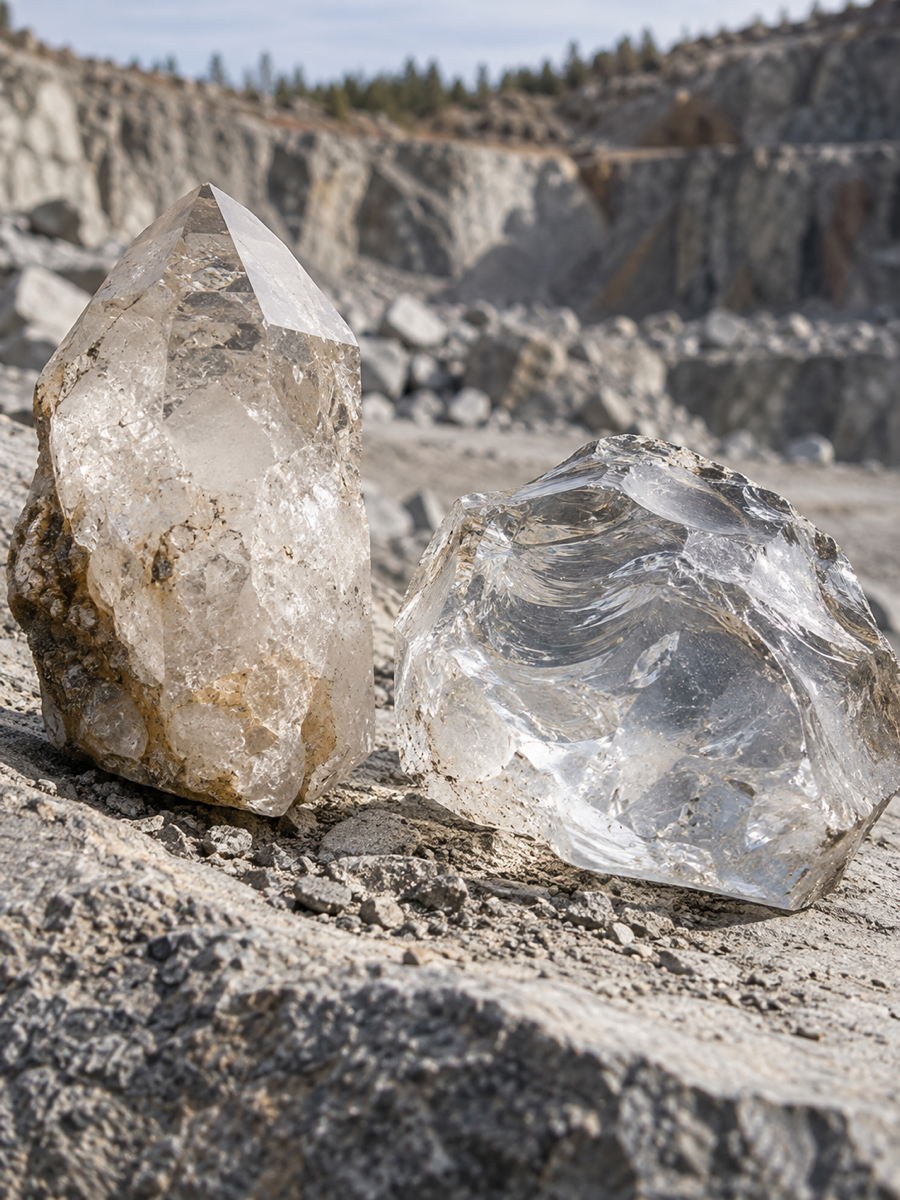
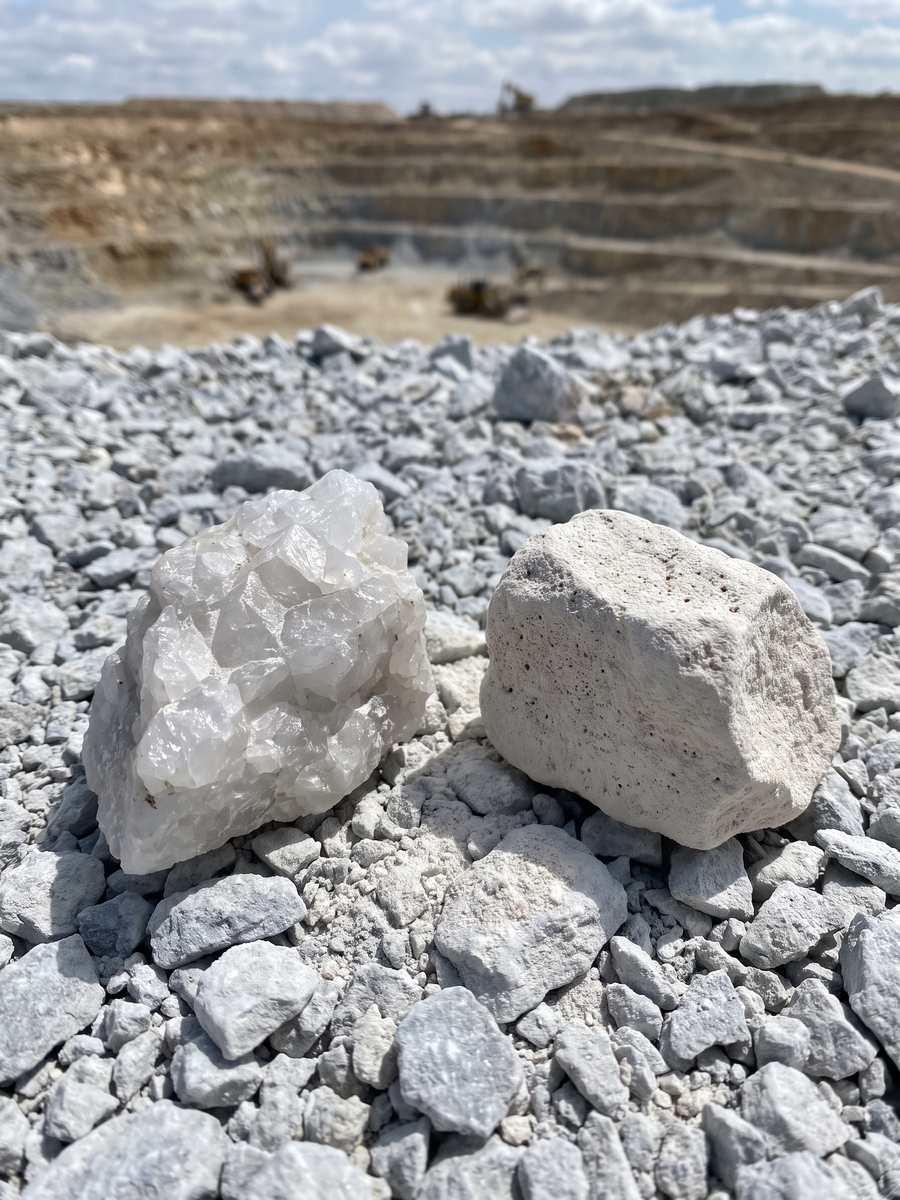
What makes mining unique is the sheer volume of quartz-bearing material that gets broken, moved, and processed every shift. A sandstone host rock can contain 60% or more quartz by weight. Granitic formations commonly range from 25% to 40%. Evenite formations considered "low silica" by geological standards, such as certain limestones, can carry seams or inclusions of chert that spike quartz content unpredictably.
The Respirable Fraction: Particles That Reach the Gas Exchange Region
NIOSH defines respirable crystalline silica as the fraction of airborne dust small enough to penetrate deep into the lungs, roughly 4 micrometers and smaller. Larger particles get trapped in the nose, throat, or upper airways. The respirable fraction bypasses those defenses entirely and deposits in the alveoli, where gas exchange occurs and where the body has limited clearance mechanisms.
This size distinction matters operationally. A haul road may generate enormous visible dust clouds, but much of that mass is coarse and settles quickly. A transfer point inside a crushing circuit may produce far less visible dust, yet a higher proportion of what it generates falls within the respirable range. Visibility is not a reliable proxy for respirable silica risk.
Definition: Respirable Crystalline Silica (RCS)
The mass fraction of airborne crystalline silica particles, predominantly quartz, that are roughly 4 micrometers and smaller in aerodynamic diameter. These particles penetrate past the body's upper airway defenses and deposit in the gas exchange region of the lungs. Analytical confirmation typically uses X-ray diffraction (NIOSH Method 7500) or infrared spectrophotometry (NIOSH Method 7602).
Where Silica Exposure Peaks Across a Mining Operation
Quartz does not distribute itself evenly across your site. The concentration in airborne dust depends on the quartz content of the material being worked, the energy applied to break it, the confinement of the space, and the effectiveness of whatever controls are in place. Some tasks consistently produce the highest readings.
Drilling and Blasting
Rotary and percussive drilling pulverize rock at the bit face, generating fine dust that exits the hole under pressure. Dry drilling without dust collection produces some of the highest personal exposures measured in mining. Blast initiation then fractures large volumes of rock instantaneously, releasing a plume of mixed-size particulate that can spread across the pit or drift before settling.
In underground operations, the confined space means blast re-entry timing and ventilation velocity directly determine how much residual respirable dust a crew inhales. Post-blast dust often carries a quartz percentage that mirrors the geology of the specific face being advanced, which can change heading by heading.
Crushing, Screening, and Transfer Points
Every time rock hits a crusher jaw, a screen deck, or a conveyor transfer point, the impact generates fresh respirable dust. Primary crushers processing ROM ore are especially problematic because the feed is unsorted and can vary in quartz content by the truckload. Secondary and tertiary crushing stages produce finer product, which means a higher proportion of the generated dust falls within the respirable range.
Transfer points deserve particular attention. Material falling from one belt to another creates a high-velocity air entrainment effect that can push fine dust out of enclosures through gaps and inspection doors. For a deeper look at how quartz content, particle generation, and health outcomes connect at each stage, the complete guide to respirable crystalline silica in mining operations maps that chain in detail.
Haul Roads, Stockpiles, and Maintenance Tasks
Haul roads generate massive dust volumes but often at coarser size fractions. The risk increases when road base material comes from quartz-rich overburden or when dry conditions persist. Stockpile loading and reclaim operations launch dust each time a bucket drops or a reclaimer cuts into the pile face.
Maintenance tasks are easy to overlook. Sweeping, dry cleanup of spilled material around processing equipment, and grinding or cutting on structural steel coated with rock dust all produce respirable silica in concentrations that can rival production tasks, sometimes in poorly ventilated maintenance bays.
Why Quartz Content Varies and a Single Number Cannot Characterize Exposure
Mining geology is heterogeneous by nature. A gold deposit hosted in quartz veins will produce dust with extremely high silica percentages when the face is in vein material, and lower percentages when the face passes through adjacent wallrock of different composition. Copper porphyry operations may see moderate quartz content in the ore zone but encounter silicified alteration halos with much higher quartz concentrations.
This geological variability translates directly into exposure variability. A safety superintendent at an underground gold mine described a single routine sampling day that returned six respirable silica results. Five of them came back at least 12 times the permissible exposure limit. One result came back at about 2,300 times the limit. This site was already trialing cab filtration and dust suppressants.
That spread across six samples collected on the same day, at the same operation, illustrates why a single time-weighted average from a quarterly compliance pull cannot represent the full exposure picture. The worker who drew the extreme result occupied a different location or task than the worker five meters away who drew a reading "only" 12 times the limit. Both results belong to the same site and the same shift, yet they describe fundamentally different exposure realities.
Regulatory Thresholds and the Measurement Gap
OSHA's permissible exposure limit for respirable crystalline silica stands at 50 micrograms per cubic meter as an 8-hour time-weighted average, with an action level of 25 micrograms per cubic meter (29 CFR 1910.1053 for general industry, 1926.1153 for construction). MSHA's 2024 silica rule aligns the mining sector to the same 50 microgram PEL and 25 microgram action level, with the metal and nonmetal provisions now in effect.
Traditional compliance sampling collects a filter cassette over a full shift, sends it to a lab, and returns a single number days or weeks later. That number is an average. It cannot tell you which 20-minute window drove the overexposure, which task was responsible, or whether your engineering controls performed well for seven hours and failed catastrophically for one. When you manage worker exposure monitoring with periodic sampling alone, you are making control decisions on incomplete evidence.
Continuous Data Catches What Periodic Sampling Misses
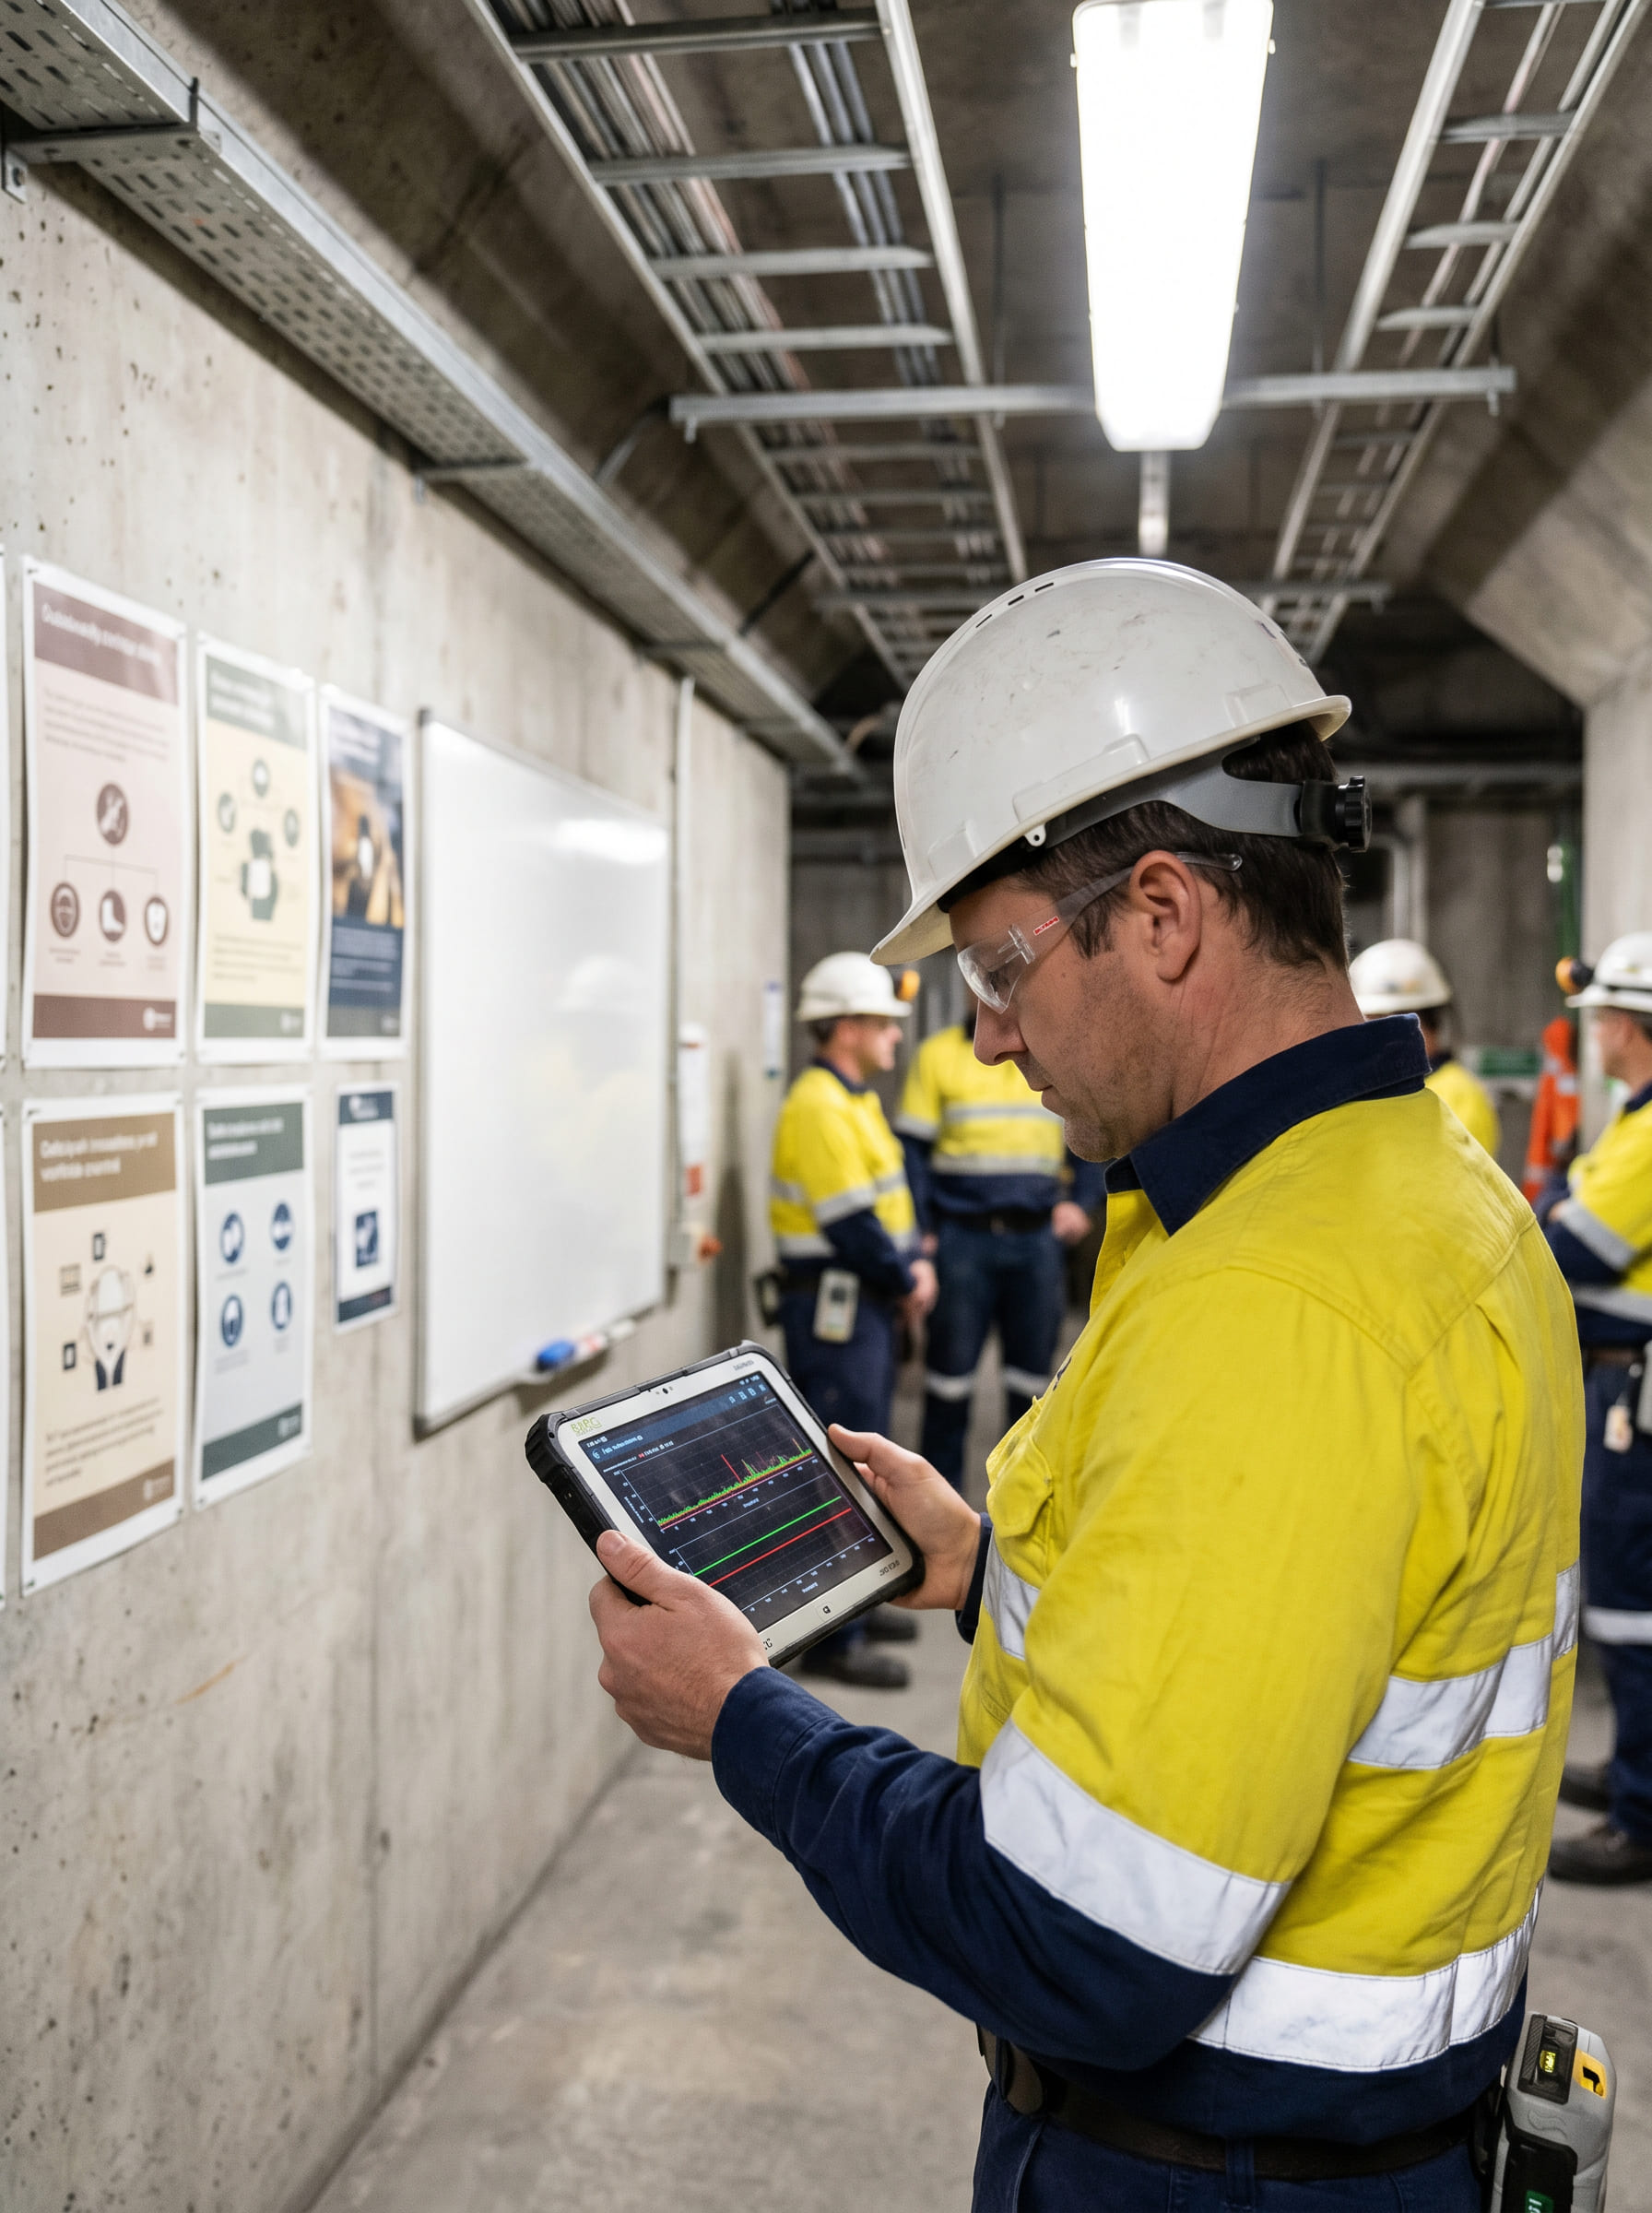
Real-time or near-real-time dust monitoring changes the information architecture of your silica program. Instead of a single integrated value per shift per worker, you get a time series: concentration readings every few seconds or minutes, tied to location, task, and environmental conditions.
That granularity reveals patterns that periodic sampling structurally cannot detect. A concentration spike lasting 15 minutes during a crusher cleanout may account for the bulk of a shift's cumulative dose, but the time-weighted average from a filter cassette only shows the final number. Continuous data shows you the spike, its timing, and its duration, which means you can trace it to the specific task, location, or control failure that caused it.
From Data to Targeted Controls
A federally funded research study that deployed APT dust sensors demonstrated the operational value of this approach. The study, conducted by NIOSH researchers, used real-time monitoring to identify specific dust generation events and validate control effectiveness in ways that periodic gravimetric sampling could not match. The sensor data provided the temporal resolution needed to link elevated concentrations to individual process steps.
This is where continuous monitoring directly supports your control hierarchy. When you can see that respirable dust spikes occur during a specific conveyor transfer at a specific tonnage rate, you can target your engineering response: adjust the water spray timing at that transfer point, modify the enclosure sealing, or change the belt speed during that material type. Without time-resolved data, you are left guessing which of a dozen potential sources drove the overexposure. Operations that integrate real-time sensing with their existing dust control programs close the loop between measurement and action far faster than those relying on lab turnaround cycles.
Building a Defensible Exposure Record
Continuous data also strengthens the quality of your similar exposure group (SEG) analysis. When you have time-series records for dozens of shifts rather than a handful of filter results per quarter, you can characterize the true distribution of exposures within each group. You can identify whether a SEG classification is valid or whether geological changes in the active face have shifted the exposure profile enough to warrant reclassification.
Applied Particle Technology's sensor and software platform supports this kind of analysis by generating the high-frequency data IH teams need to validate controls, refine SEG boundaries, and respond to exceedances in near real time rather than weeks after the fact.
Frequently Asked Questions
Q: How should we prioritize where to deploy limited real-time monitors first?
A: Start with roles and locations that combine high-energy breakage with confinement or frequent intervention, then expand based on early hotspot findings. Pair initial deployments with a short observation period to capture representative variability across shifts, material types, and operating modes.
Q: What change management steps help crews trust and use continuous exposure data?
A: Introduce the program with clear goals, protection and prevention, not punishment, and explain how data will be used and who can access it. Provide quick feedback loops, such as showing how a process tweak reduced peaks, so workers see direct value from participation.
Q: How can silica insights be built into pre-shift planning and daily production meetings?
A: Add a short silica risk check that reviews expected geology changes, planned high-dust tasks, and any recent peak events, then assign controls and responsible owners. Treat it like a standard operating constraint alongside safety, maintenance, and throughput.
Q: What are practical KPIs beyond an 8-hour average that better reflect silica risk?
A: Track peak intensity, peak duration, and frequency of excursions above an internal threshold, plus time-to-correct after an alert. These metrics help prioritize fixes that reduce high-dose events, even when shift averages appear acceptable.
Q: How do you validate that an engineering control is still performing over time?
A: Establish a baseline performance signature under known operating conditions, then compare future readings to that pattern after maintenance, seasonal changes, or production adjustments. If the signature drifts, investigate common degradation points like clogged sprays, damaged seals, or altered airflow paths.
Q: How can contractors and short-duration tasks be managed when traditional sampling is impractical?
A: Use task-based risk controls, defined high-dust permits, and portable monitoring during the specific activity window to confirm conditions are controlled. Include silica requirements in contractor scopes, including cleanup methods, ventilation expectations, and stop-work triggers for elevated readings.
Q: What data governance practices are important for a defensible silica program?
A: Define calibration and maintenance routines, document sensor placement rules, and standardize how tasks and locations are labeled so data stays comparable. Maintain an audit trail for alerts, investigations, and corrective actions to demonstrate consistent decision-making.
The Geology Does Not Wait for Your Next Sample
Silica risk in mining is a geological problem with an industrial hygiene solution. The quartz is always there, bound into the host rock, released every time you break ground. The concentrations shift with the geology, the task, the ventilation, and the weather. Quarterly sampling captures a snapshot. Continuous monitoring captures the story.
The underground gold mine data referenced earlier, six samples from one day spanning a range from 12 times to about 2,300 times the PEL, is not an outlier. It is what variable geology and high-energy rock breaking produce when you look closely enough. The question for every mining IH program is whether you are looking closely enough to see what your operation actually generates.
If you want to see how continuous silica monitoring maps to your specific operation, geology, and control strategy, book a personalized demo with Applied Particle Technology.
Take a tour of APT's dust management platform

Vulcan Materials Company is the nation’s largest producer of construction aggregates.

Project partner
Brent Leclerc | Environmental Manager
Problems solved
Unjustified community dust complaints & lawsuits
Difficulty complying with opacity regulations and risk of NOVs
Solution
Real-time dust monitoring
Dust maps proving no community impact, preventing fines & lawsuits
Real-time opacity monitoring, high degree of compliance


.png)
Better decisions start with real-time insight
APT helps industrial teams move faster, act smarter, and stay compliant—because when you can see the problem clearly, you can solve it confidently.
