A quarterly silica sampling report lands on your desk, and every result sits below the OSHA permissible exposure limit of 50 micrograms per cubic meter. The program looks compliant. But that report captured one shift, on one worker, on one day, and then extrapolated that snapshot across thousands of unmonitored hours. The question worth asking: what happened on all the other days?
Respirable crystalline silica exposure is episodic. It spikes during specific tasks, under specific conditions, and then recedes. A periodic silica sampling calendar, by design, cannot see the peaks that fall between scheduled rounds. The sampling interval itself is the blind spot, and understanding why requires a closer look at how exposure actually behaves versus how sampling programs assume it behaves.
Periodic vs. Continuous Silica Monitoring: A Confidence Problem
Periodic exposure monitoring collects a filter-based air sample over a single work shift, typically once per quarter or twice per year, then sends it to an accredited laboratory for gravimetric and crystalline analysis per NIOSH Method 7500 (XRD) or Method 7602 (IR). The result is a single 8-hour time-weighted average that represents one point on a distribution you never actually characterize.
Continuous exposure monitoring, by contrast, uses wearable or area-based sensors to record respirable dust concentrations at intervals of seconds to minutes, across every shift, generating thousands of data points per worker or location per month. The distinction matters because data density determines statistical confidence. One sample per quarter gives you four data points per year. A continuous monitor running at 15-second intervals generates over 600,000 readings in the same period.
The difference between those two datasets is the difference between guessing and knowing. And when the contaminant in question is an IARC Group 1 carcinogen that causes irreversible lung disease, guessing carries real consequences for workers.
Five Failure Modes of Periodic Silica Sampling
Periodic programs fail in predictable ways, and each failure mode compounds the others. Recognizing them is the first step toward building a monitoring strategy that reflects actual exposure conditions rather than sampling convenience.
Temporal Aliasing: Sampling at the Wrong Frequency
In signal processing, temporal aliasing occurs when a sampling rate is too low to capture the true frequency of a signal. The same principle applies to occupational hygiene. Silica exposure varies by task, by shift, by weather, by equipment condition, and by production schedule. A quarterly sample captures one frame of a film that changes scene by scene. If the sample happens to land on a low-exposure day, the data looks clean. If it lands on a high-exposure day, you get a single exceedance with no context about how often that condition recurs.
Neither result tells you what the exposure distribution actually looks like. You cannot characterize variability from a handful of points, and variability is the entire story with respirable crystalline silica, which exists as particles roughly 4 micrometers and smaller that penetrate deep into lung tissue.
The Single-Shift Snapshot
A personal sample captures one worker performing one set of tasks during one shift. But production demands shift daily. A crusher operator might run a different feed stock on Tuesday than on Thursday. Maintenance crews perform tear-downs on rotating schedules. The single-shift snapshot assumes that the sampled shift represents normal conditions, yet "normal" in most operations is a moving target.
At an anonymized iron-ore operation, continuous monitoring data revealed that a single task filling just 22 percent of the shift drove 44 percent of the worker's full-shift silica dose. A periodic sample that happened to miss that task, or caught it on a lighter day, would have produced a fundamentally misleading TWA.
Day-to-Day Variability
Exposure science has long recognized that day-to-day variability within a single worker often exceeds the variability between workers in the same job group. Geometric standard deviations of 2.0 to 3.0 are common in dusty trades. A TWA of 30 micrograms per cubic meter on the sampled day might sit alongside unsampled days at 80 or 120. Without sufficient data points, you cannot calculate the 95th percentile of the exposure distribution, which is the metric that actually determines whether a worker is protected.
The Lab-Result Lag
Filter-based samples require shipment to an accredited laboratory, where turnaround times of two to four weeks are standard. By the time results arrive, the conditions that produced them may have changed, or they may have persisted for an additional month without anyone knowing. At a large copper operation, a real-time monitor flagged a dust event eight to ten minutes before the fixed ductwork monitor detected it. That speed gap matters. With periodic sampling, the equivalent gap stretches from weeks to months, and no corrective action happens in the interim.
The Task-Attribution Gap
A filter sample returns a single number: the mass of crystalline silica collected over the sampling period. It cannot tell you which task, which piece of equipment, or which 20-minute window generated the majority of that dose. Without task attribution, you cannot prioritize engineering controls effectively. You know the exposure was high, but you do not know where to intervene. This makes the understanding of how real-time monitoring differs from filter-based sampling operationally significant, not just academically interesting.
EN 689 Assessments Are Only as Strong as Data Density
The European standard EN 689, and its conceptual parallel in AIHA exposure assessment guidance, provides a statistical framework for deciding whether a similar exposure group (SEG) is compliant. The framework requires representative measurements, accounts for lognormal distributions, and uses upper confidence limits to make compliance decisions. On paper, it is rigorous.
In practice, the framework is only as good as the data feeding it. EN 689 recommends a minimum number of samples per SEG, but many programs treat that minimum as the target. Six samples spread across a year do not capture seasonal variation, production surges, or equipment degradation cycles. The statistical decision, whether an SEG passes or fails, shifts dramatically when you add or remove even one high-exposure data point from a small sample set.
Continuous monitoring changes the math entirely. Instead of defending a compliance decision on six or nine data points, you build the full exposure distribution from thousands of measurements. Outliers become visible. Trends emerge. And the confidence interval around your compliance decision narrows to the point where it is genuinely defensible under regulatory scrutiny, including the MSHA 2024 silica rule (PEL 50, AL 25) now in effect for metal and nonmetal operations.
Building a Defensible Silica Exposure Profile with Continuous Data
Continuous wearable and area monitors, paired with a risk-assessment engine, address each of the failure modes described above. They sample at frequencies that eliminate temporal aliasing. They run across every shift, removing single-day bias. They generate the data density required to characterize day-to-day variability. They deliver results in real time, closing the lab-result lag. And when paired with task logs or location tagging, they attribute dose to specific activities.
Validating Controls Between Silica Sampling Rounds
The operational value extends beyond compliance paperwork. Continuous data lets you verify that an engineering control, a ventilation upgrade, a water suppression system, a cab pressurization seal, is performing as designed on every shift, not just on the day the industrial hygienist visits. When performance degrades, alerts trigger same-shift corrective action instead of quarter-delayed discovery.
A federally funded research study that deployed APT dust sensors, conducted with NIOSH, demonstrated the feasibility of networked low-cost dust monitors in occupational settings, generating real-time spatial and temporal granularity that filter-based programs cannot match. The study validated that continuous area monitoring complements and strengthens traditional personal sampling by filling the data gaps between rounds.
Reducing Sampling Burden with Better Data
Better data does not mean more sampling campaigns. It often means fewer. At one sand operation, continuous monitoring data replaced roughly $22,000 per year of individual sampling costs, and real-time monitoring typically reduces routine sampling campaigns by as much as 70 percent. The savings come not from cutting corners but from replacing low-confidence periodic snapshots with high-confidence continuous records that make redundant sampling rounds unnecessary.
Applied Particle Technology's worker exposure monitoring platform and analytics engine generate the continuous distributions that transform compliance programs from assumption-based to evidence-based.
At a specialty minerals mill in North Carolina, five APT Maxima monitors provided one full year of continuous, location-tagged respirable silica data feeding a daily preventive-maintenance plan under the MSHA rule now in effect.
Frequently Asked Questions
Q: Does continuous monitoring eliminate the need for traditional lab-based silica sampling?
A: No. Continuous monitoring is best used alongside periodic lab analysis to confirm silica content and support regulatory documentation. The combination strengthens defensibility by pairing compositional certainty with day-to-day exposure visibility.
Q: How do you set meaningful alert thresholds for real-time dust monitors without creating alarm fatigue?
A: Start with a tiered approach, including informational alerts for short spikes and action alerts for sustained elevations. Calibrate thresholds using your first few weeks of baseline data, then refine by task and location so alerts map to controllable situations.
Q: What is the best way to train crews to use continuous monitoring data productively?
A: Focus training on a few repeatable actions, such as pausing to adjust water suppression, checking ventilation status, or changing work positioning when alerts occur. Short, task-based coaching sessions tend to work better than classroom-only instruction because workers can immediately connect readings to cause and effect.
Q: How should companies handle privacy and trust concerns with wearable exposure sensors?
A: Establish clear policies that define the purpose as exposure reduction, not performance management, and communicate who can access the data and for what use cases. Aggregating results by similar exposure groups where appropriate, while still enabling targeted hazard control, helps maintain transparency and trust.
Q: How can continuous monitoring support contractor management and short-duration work like maintenance shutdowns?
A: Use temporary area monitors and quick-deploy wearables to capture high-risk, non-routine work that is often missed by planned sampling schedules. The data can be used to validate contractor controls, tailor PPE requirements, and document exposure conditions for after-action reviews.
Q: What should an operation do first if continuous data reveals frequent spikes but the full-shift averages seem acceptable?
A: Treat spikes as opportunities for targeted control improvements, such as adjusting work practices, isolating the source, or improving capture and suppression at the point of generation. Short-duration peaks can still drive risk and should be investigated with task notes, photos, or location context to pinpoint root causes.
Q: How can continuous exposure data be incorporated into safety KPIs without oversimplifying the risk?
A: Track a small set of metrics that reflect both frequency and severity, such as time above an internal action level, number of spike events per shift, and trend lines before and after control changes. Pair these with leading indicators like control uptime and corrective action closure rates to keep the focus on prevention.
The Sampling Calendar Is the Blind Spot
Periodic silica sampling programs were designed for an era when filter cassettes and laboratory analysis were the only option. They served their purpose. But treating a quarterly snapshot as a complete picture of worker exposure is a statistical error that compounds with every unmonitored shift. The spikes happen between sampling days. The highest-risk tasks fall in the gaps. And the confidence you place in your compliance decision should reflect the density of data behind it, not the frequency of a calendar reminder.
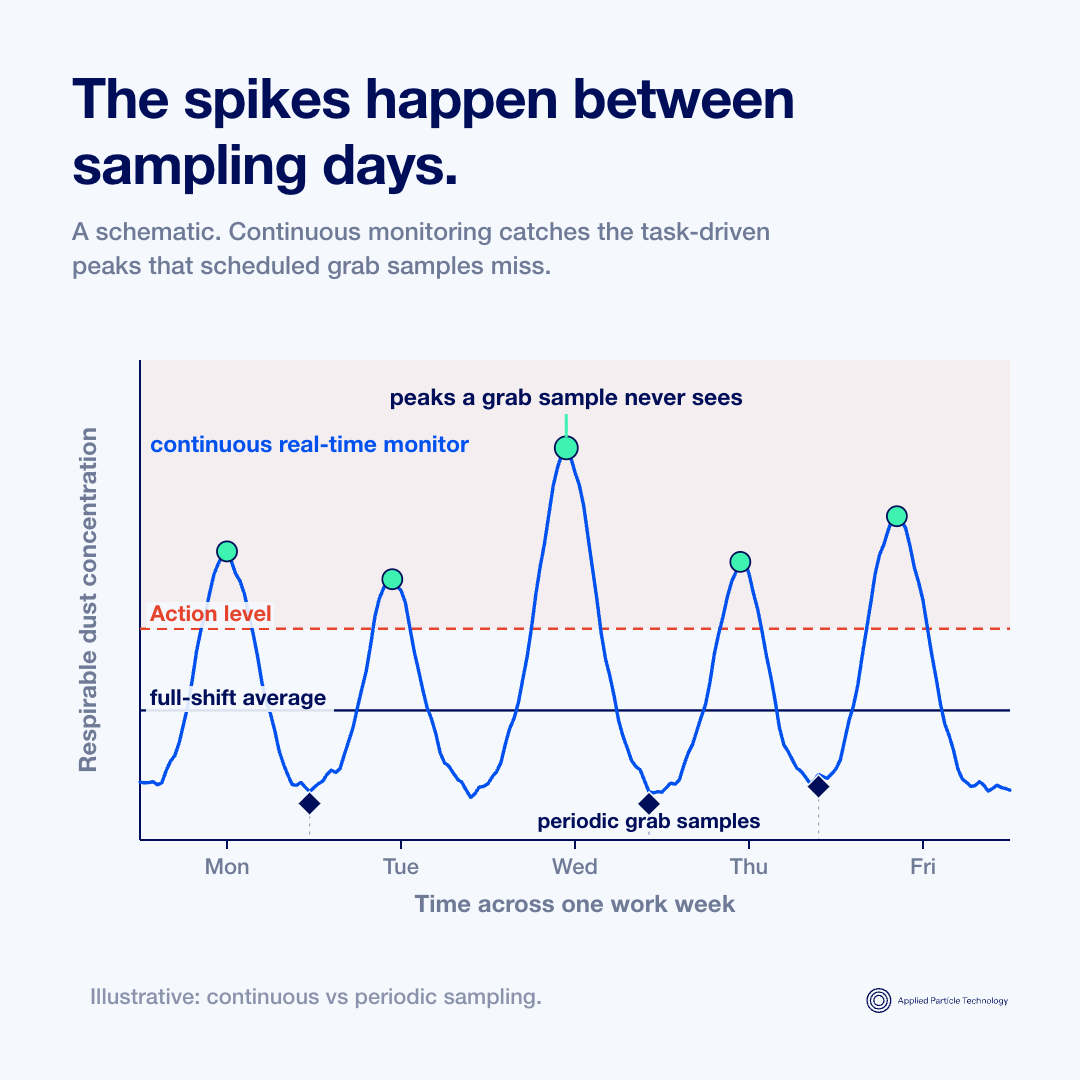
Continuous monitoring does not replace the need for accredited laboratory analysis. It fills the spaces between those analyses with actionable, real-time data that makes every periodic result more meaningful and every engineering control verifiable.
If your periodic program leaves you defending compliance decisions on a handful of data points, it may be time to see what continuous exposure data looks like for your operation. Book a personalized demo to explore how real-time silica monitoring builds the defensible exposure profiles your program needs.
Take a tour of APT's dust management platform

Vulcan Materials Company is the nation’s largest producer of construction aggregates.

Project partner
Brent Leclerc | Environmental Manager
Problems solved
Unjustified community dust complaints & lawsuits
Difficulty complying with opacity regulations and risk of NOVs
Solution
Real-time dust monitoring
Dust maps proving no community impact, preventing fines & lawsuits
Real-time opacity monitoring, high degree of compliance






Better decisions start with real-time insight
APT helps industrial teams move faster, act smarter, and stay compliant—because when you can see the problem clearly, you can solve it confidently.
